Fibonacci Indicator in Forex: A Guide to Smart Entries and Exits
 Fibonacci Indicator in Forex: A Guide to Smart Entries and Exits
When it comes to precise entries and exits in forex trading, few tools are as popular and effective as the Fibonacci Indicator in Forex. If you’re looking to sharpen your strategy and reduce the guesswork, Fibonacci retracement levels could be your missing key.
In fact, understanding how Fibonacci levels work can complement other important strategies like using trading wicks and analyzing your risk-reward ratio. You can check out my previous post on Trading Wicks in Forex to build a solid base before diving deeper into this powerful indicator.
Let’s explore how this timeless tool can help elevate your trades.
What Is the Fibonacci Indicator in Forex?
The Fibonacci Indicator in Forex is a technical analysis tool based on the Fibonacci sequence, a set of numbers with a consistent ratio found in nature and financial markets. In trading, the most commonly used levels are 23.6%, 38.2%, 50%, 61.8%, and 78.6%.
Traders apply this tool to identify possible reversal points and support/resistance levels in trending markets. When the price retraces to these key percentages, it often reacts giving you a chance to either enter or exit trades with confidence.
Why Use the Fibonacci Indicator in Forex Trading?
The power of the Fibonacci indicator lies in its ability to provide clarity in chaos. Markets can feel unpredictable, but Fibonacci levels create a roadmap. These levels help traders:
-
Identify strategic pullback zones
-
Set precise entry and exit points
-
Place stop-losses more effectively
-
Boost their probability of profitable trades
When used in combination with candlestick patterns, trend lines, and volume, the Fibonacci tool becomes even more powerful.
 How to Apply Fibonacci Retracement Correctly
1. Identify the Trend
To begin, locate a significant price move, either an uptrend or downtrend. This could be a swing low to swing high (for a bullish move) or swing high to swing low (for a bearish move).
2. Draw the Fibonacci Tool
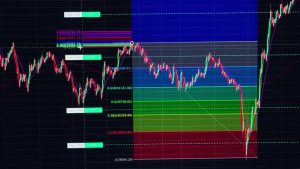
Using your charting platform (like MT4, TradingView, or cTrader), select the Fibonacci retracement tool and connect the swing points. The tool will then display the key retracement levels automatically.
3. Watch the Price Reaction
Observe how the price reacts at levels like 38.2%, 50%, or 61.8%. These zones often signal a bounce, continuation, or reversal.
Transitioning from just observing to acting requires confidence and that’s where experience comes in.
Combining Fibonacci Indicator in Forex with Support and Resistance
The Fibonacci Indicator in Forex becomes even more accurate when combined with key support and resistance zones. If a Fibonacci level aligns with a known resistance, the likelihood of a price reversal increases dramatically.
This synergy helps confirm that the retracement level isn’t just a random bounce but a calculated pivot point.
Using Fibonacci Indicator in Forex for Smart Entry Points
Smart traders don’t chase the market; they wait for the price to pull back. When the price retraces to a Fibonacci level, especially 38.2% or 61.8%, it’s often a prime opportunity to enter in the direction of the trend.
Place your entry orders just above these levels in an uptrend or just below in a downtrend. Ensure to use candlestick confirmation (like pin bars or engulfing candles) before jumping in.
Fibonacci for Exit and Take-Profit Zones
Just as the tool can help you enter the trade, it’s equally powerful in helping you exit. Fibonacci extension levels like 127.2% and 161.8% often mark the end of price moves.
You can set your take-profit targets around these zones, locking in gains before the market turns.
Risk Management with Fibonacci
One of the top uses of the Fibonacci Indicator in Forex is improving your risk management. By placing stop-loss orders just beyond key Fibonacci levels, you avoid emotional decision-making and limit losses.
For example, if you buy at the 38.2% retracement level, place your stop-loss just below the 50% or 61.8% level. This tightens your risk while giving the trade room to move.
Also, remember to match this setup with a healthy Risk-Reward Ratio. Check out my full article on why it’s a critical part of long-term success here:
👉 Risk-Reward Ratio in Forex: Key to Long-Term Success
Common Mistakes to Avoid with Fibonacci
Even though it’s a popular tool, some traders misuse Fibonacci. Here are common errors to avoid:
-
Drawing the tool on minor swings: Stick to significant trends for better results.
-
Ignoring market structure: Use Fibonacci as part of a broader strategy, not as a stand-alone tool.
-
Not waiting for confirmation: Don’t enter blindly at Fibonacci levels. Always wait for confirmation from price action.
Final Thoughts: Make Fibonacci Part of Your Trading Arsenal
The Fibonacci Indicator in Forex isn’t a magical formula, but it’s a proven way to improve your timing, reduce losses, and boost your win rate. Whether you’re a beginner or an experienced trader, integrating this tool into your strategy can give you the edge you’ve been looking for.
And remember, pairing Fibonacci with strong risk-reward planning and candle pattern recognition can take your trading to the next level. If you haven’t read it yet, check out this guide on why mastering your Risk-Reward Ratio in Forex is absolutely key to long-term trading success.
Stay consistent, keep learning, and trade smart.
Let’s connect!
📲 Follow me on Instagram: https://www.instagram.com/shine.dubic
👥 Join my Forex Facebook Group: https://web.facebook.com/profile.php?id=100072302632130&sk=about
🌐 Explore more articles on https://fxfreelancehub.com
[…] Before diving deep into TradingView’s benefits, be sure to explore this important guide on using the Fibonacci indicator in forex for smart entries and exits to improve your timing and […]